

I agree Our site saves small pieces of text information (cookies) on your device in order to deliver better content and for statistical purposes. You can disable the usage of cookies by changing the settings of your browser. By browsing our website without changing the browser settings you grant us permission to store that information on your device.
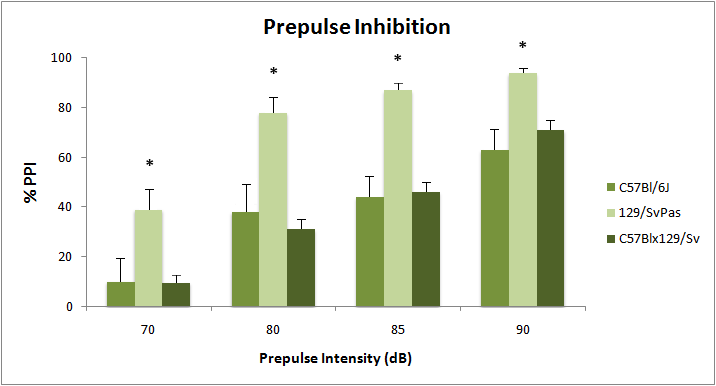
The startle is a reflexive response to strong exteroceptive stimuli (acoustic or tactile). Pre-pulse inhibition (PPI) is the normal reduction of the startle reflex to an intense stimulus (acoustic or tactile) when this stimulus is immediately preceded by a non-startling prepulse. PPI provides an operational measure of sensorimotor gating which reflects the ability of an organism to properly inhibit sensory information. Amplitude of startle might give indication about motor deficits or anxiety. This assay could also be used to analyze depression-like behavior.
Eight startle chambers (SRLAB, San Diego Instruments, San Diego, CA) are used for evaluation of the acoustic or tactile startle.
10 mice per group are recommended for reliable data analysis.
Studies of angiogenesis benefit from the ability to non-invasively examine eye vasculature. This technique makes use of fluorescent dyes to demarcate blood vessels and examine vascular dynamics over time.
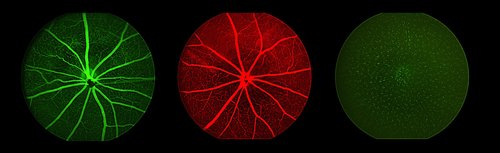
Flourescent imaging of the fundus after intravenous injection of fluorophores (fluorescein and Evan’s blue) or cellular GFP expression in a transgenic mouse.
Similar to auditory test in clinical settings, the ABR provides a measurement of the sensorineural as well as conductive hearing impairment by directly examining the neuronal excitation elicited by auditory stimuli.
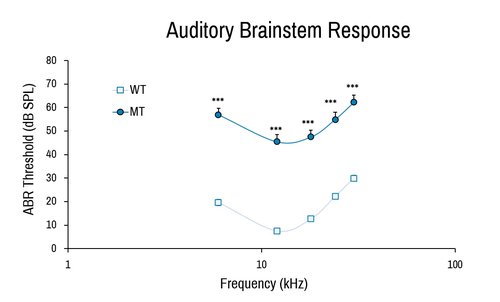
Comparison of wild-type (WT) and Baiap2l2 deletion (MT) female in auditory brainstem response. The severe deafness of the Baiap2l2 mutant results in much higher ABR threshold measurements. ***, p<0.001
Electroretinography evaluates in vivo the activity of retinal cells, from photoreceptors (a-wave) and inner retina neurons (b-wave, oscillatory potentials). Activity of rod or cone circuits can be isolated by dark- or light-adaptation of the retina, as well as changing the stimuli frequency.
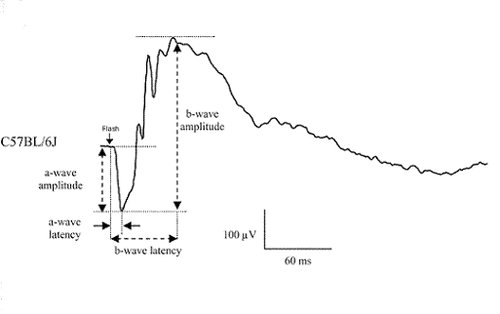
Example of classical ERG recording from a C57BL/6 mouse under scotopic condition. The a-wave amplitude and latency provide information on photoreceptor function while the b-wave amplitude and latency are indicative of postsynaptic neuronal function. Different light stimuli can selectively activate either the rod or the cone pathway.
Siem Visiosystem (Siem Bio-Médicale, Nîmes, France)
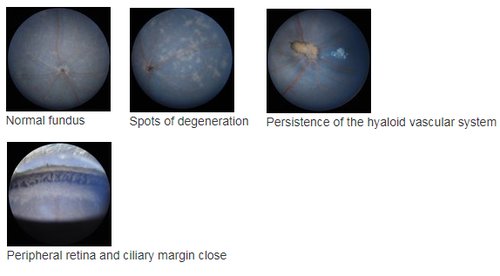
Fundus imaging allows detecting anomalies in retinal structure, pigmentation and/or vasculature, as occurring in various retinal diseases as retinitis pigmentosa (RP), glaucoma and other types of retinal degeneration. This can be combined with OCT to help precise the localization of retinal lesions. In addition, the high sensitivity of the Micron III allows in vivodetection of fluorescent proteins or markers, for instance for longitudinal follow-up of cell populations expressing GFP or RFP, or monitoring the efficacy of viral infection (gene therapy).
Micron IV with GFP and RFP filters (Phoenix Labs, Pleasanton, CA, USA)
TEFI (Paques et al., IOVS 2007), which can be brought to other animal facilities if needed due to sanitary status of the animals.
Non invasive in vivo histology of the retina with 2-3 µm axial resolution, allowing precise thickness measurement of all retina layers, including photoreceptor segments. Sites (and size) of retinal lesions can thus be identified, and their evolution tracked over time, either to characterize a disease progression, of the efficacy of a pharmacological or gene therapy treatment.
, and detection of retinal lesions, as in (2) representing a transition between a non-affected area (right) and a zone with spots of degeneration caused by the rd") OCT allows measuring the various retinal layers with 2-3 µm precision in the optical axis (1), and detection of retinal lesions, as in (2) representing a transition between a non-affected area (right) and a zone with spots of degeneration caused by the rd
OCT allows measuring the various retinal layers with 2-3 µm precision in the optical axis (1), and detection of retinal lesions, as in (2) representing a transition between a non-affected area (right) and a zone with spots of degeneration caused by the rd
 The distribution of lesions in the retina can be visualized by “en face” views, which can be focused on a given retinal layer.
, or a more severe alterations with retinal thinning and persitence of many hyaloid vessels in") Data can be visualized in 3D to better visualize some anomalies, as a partial vessel detachment from the retinal surface and persistence of a hyaloid vessel (1), or a more severe alterations with retinal thinning and persitence of many hyaloid vessels in
Data can be visualized in 3D to better visualize some anomalies, as a partial vessel detachment from the retinal surface and persistence of a hyaloid vessel (1), or a more severe alterations with retinal thinning and persitence of many hyaloid vessels in
Bioptigen EnVisu R2200 (Bioptigen, Durham, NC, USA)
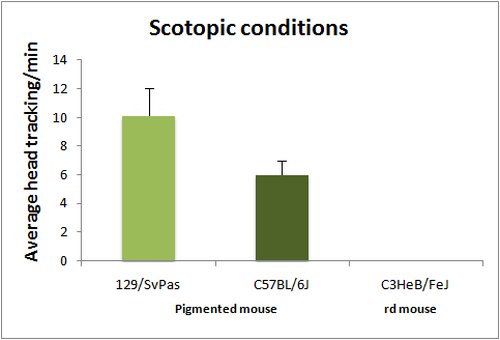
The optomotor test is based on the reflex tracking of moving objects in the visual field. While in humans this is achieved essentially through the optokinetic reflex, involving only eye movements, mice tend to follow moving objects through head movements, than can be easily visualized either in normal or low light conditions (with IR illumination). Mice are placed in the center of a rotating drum, which inside wall is covered with alternating black and white stripes, with spatial frequencies ranging from 0.03 to 1.25 cycles/degree (standard spatial frequency for first line testing is 0.26 cycle/degree). Head tracking of the bar movements is absent in blind animals. Visual acuity can be assessed by changing the bar spatial frequency. Absence of head tracking can have many origins. Notably albinos strains do not respond to the optomotor test, due to a defect in projections of the ganglion cells involved in this reflex.
 Head tracking are quantified by scoring either the number of head movements per minute or averaging the total tracking time per minute.
Head tracking are quantified by scoring either the number of head movements per minute or averaging the total tracking time per minute.
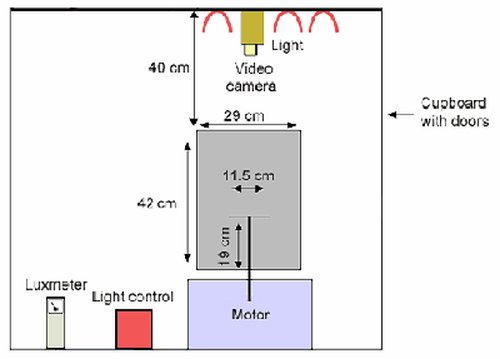
Schematic diagram showing the dimensions of the visual tracking drum. Drum dimensions, diameter 29.0 cm, height 42.0 cm. The mouse is placed on a stationary grated platform of 11.5 cm diameter and raised above the floor of the drum by 19 cm. The drum is housed within a cupboard, with a stabilising arm fixed 40 cm above the mouth of the drum. This arm is to hold the video camera. Three 60 watt bulbs are 40 cm above the mouth of the drum and are operated via a light control.
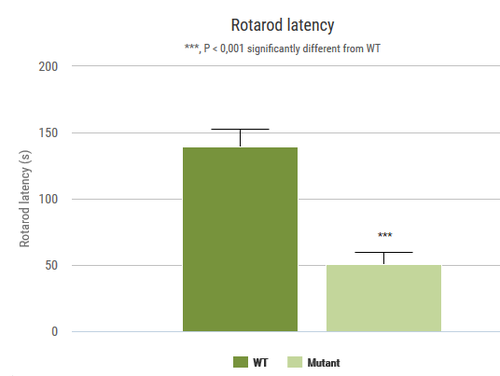
This test measures the ability of an animal to maintain balance on a rotating rod. This task requires a variety of proprioceptive, vestibular and fine-tuned motor abilities.
2 rotarod apparati (BIOSEB, Vitrolles, France)
10 mice per group are recommended for reliable data analysis.
General ophthalmic observation to detect gross eye or eyelid defects (microphthalmia, eyelid closure, bulging eye, corneal opacities, lack of pupil response to changing light level...), followed by a detailed examination of the anterior segment of the eye (cornea, aqueous humor, lens, and vitreous) with a thin (slit) illumination, to better visualize anomalies in these transparent compartments. This test does not require anesthesia, as the anterior segment can be well-observed on vigil mice gently hand-held. Digital imaging can be obtained from anesthetized mice.
 Cataract
 Corneal opacity with neovascularization
 Corneal mineralization
 Corneal opacity with abnormal pupil shape close
All images taken with TEFI (Nikon DSLR + 85 mm f/1.8 lens, coupled to an Hopkins endoscopic optic).
SL-990 Slit Lamp (CSO, Firenze, Italy)
Micron III with slit lamp extension (Phoenix Labs, Pleasanton, CA, USA)
See our Anatomopathology dedicated page to explore all our available tests.
See our Gene expression analysis dedicated page to explore our different related tests.
See our In vivo Viral Transduction dedicated page to explore our frequently used vectors and delivery modes including stereotactic admininistration (intraventricular and cerebellar)
See our In vivo Viral Transduction dedicated page to explore our frequently used vectors and delivery modes including stereotactic admininistration (intraventricular and cerebellar)